【Swift UI】Swift Chartsで折れ線グラフの実装方法!ポインタや曲線など

この記事からわかること
- Swift UIで使えるSwift Chartsフレームワークの使い方
- 折れ線グラフの実装方法
- ポインタやグラフの曲線などをカスタマイズ
index
[open]
\ アプリをリリースしました /


環境
- Xcode:15.0.1
- iOS:17.1
- Swift:5.9
- macOS:Sonoma 14.1
Swift Chartsフレームワークとは?
「Swift Charts」はSwift UIで使用できるフレームワークでグラフを簡単に作成、カスタマイズすることが可能です。Apple公式から提供されているので導入作業などは必要なく、import Chartsと記述することで使用できるようになります。
折れ線グラフの実装方法
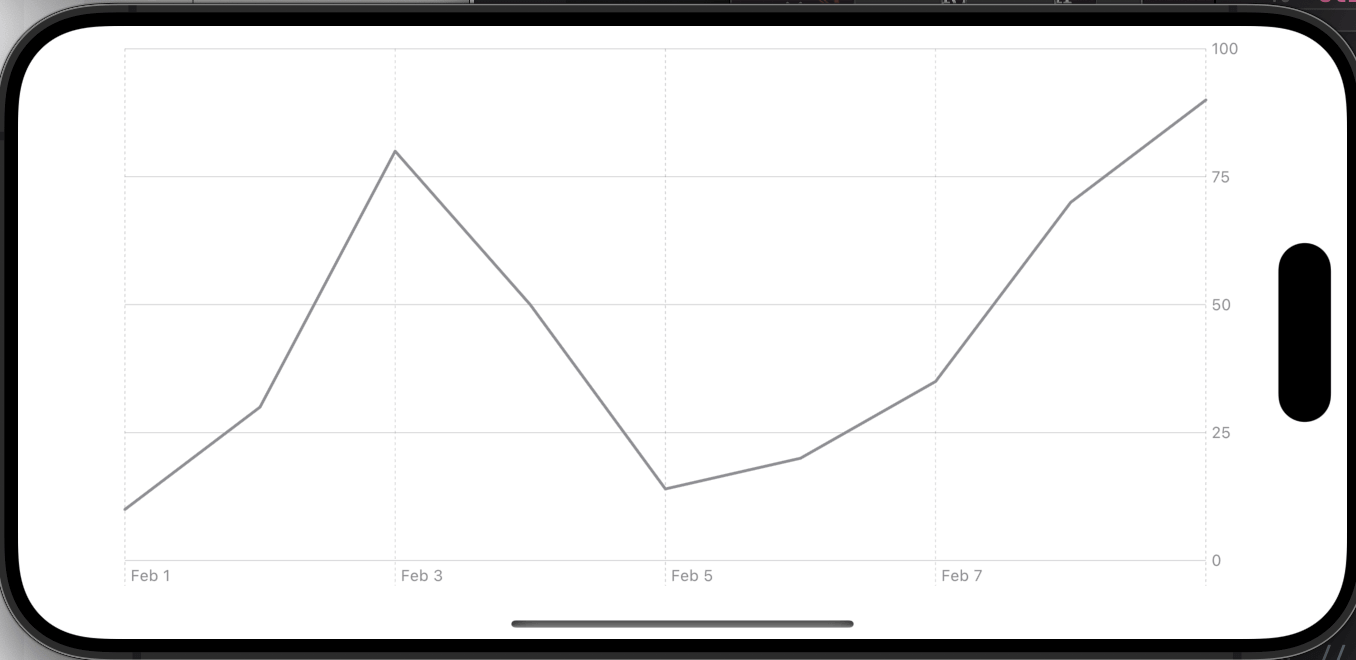
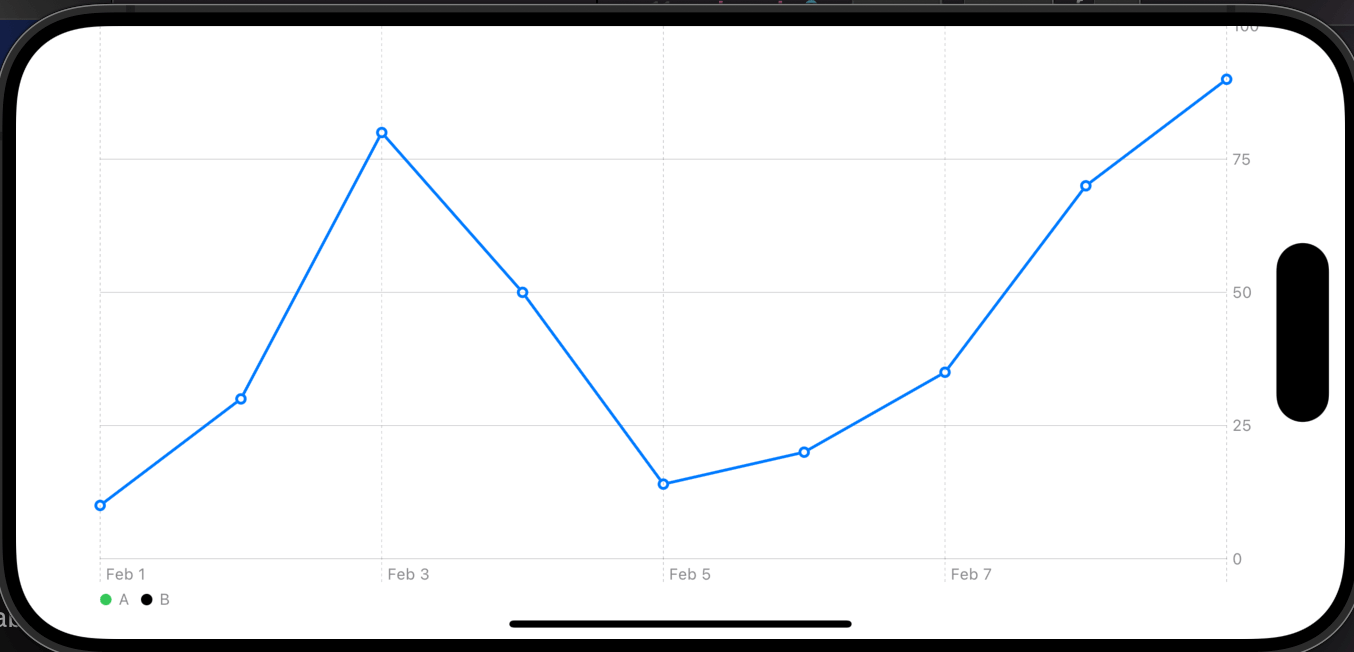
Swift Chartsで折れ線グラフを実装するためにはLineMark構造体を使用します。基本的な実装方法は棒グラフの時と変わらず、LineMarkに入れ替えるだけです。
struct Record: Identifiable {
    var id: UUID = UUID()
    let date: Date
    let score: Int
}

struct ContentView: View {

    var records: [Record] = [
        Record(date: DateComponents(calendar: .current, year: 2024, month: 2, day: 1).date!, score: 10),
        Record(date: DateComponents(calendar: .current, year: 2024, month: 2, day: 2).date!, score: 30),
        Record(date: DateComponents(calendar: .current, year: 2024, month: 2, day: 3).date!, score: 80),
        Record(date: DateComponents(calendar: .current, year: 2024, month: 2, day: 4).date!, score: 50),
        Record(date: DateComponents(calendar: .current, year: 2024, month: 2, day: 5).date!, score: 14),
        Record(date: DateComponents(calendar: .current, year: 2024, month: 2, day: 6).date!, score: 20),
        Record(date: DateComponents(calendar: .current, year: 2024, month: 2, day: 7).date!, score: 35),
        Record(date: DateComponents(calendar: .current, year: 2024, month: 2, day: 8).date!, score: 70),
        Record(date: DateComponents(calendar: .current, year: 2024, month: 2, day: 9).date!, score: 90)

    ]

    var body: some View {
        Chart(records) { record in
            LineMark(
                x: .value("年月日", record.date),
                y: .value("点数", record.score)
            ).foregroundStyle(.gray)
        }
    }
}
複数の折れ線グラフを表示する
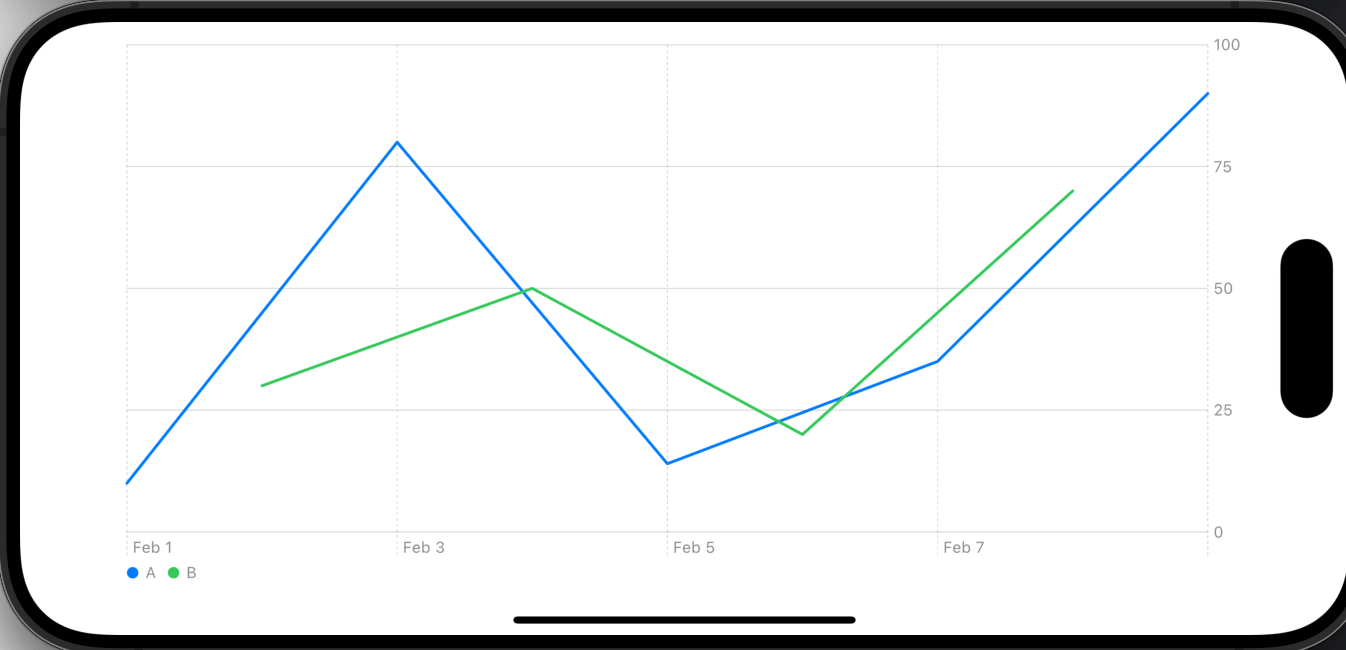
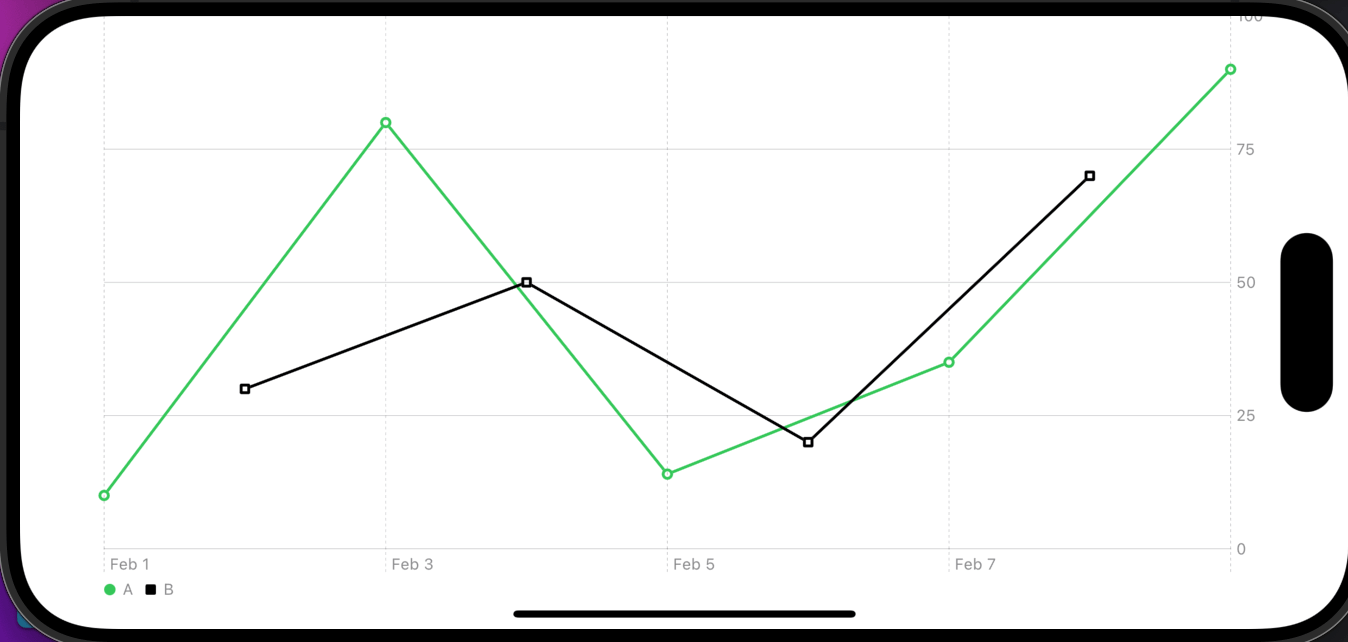
表示するデータの特定のプロパティで分けて折れ線グラフを実装したい場合はforegroundStyle(by:)を使用して.value("カテゴリ名", 値)形式で渡すことで自動でデータごとに折れ線グラフを実装してくれます。
struct ContentView: View {

    var records: [Record] = [
        Record(date: DateComponents(calendar: .current, year: 2024, month: 2, day: 1).date!, score: 10, category: "A"),
        Record(date: DateComponents(calendar: .current, year: 2024, month: 2, day: 2).date!, score: 30, category: "B"),
        Record(date: DateComponents(calendar: .current, year: 2024, month: 2, day: 3).date!, score: 80, category: "A"),
        Record(date: DateComponents(calendar: .current, year: 2024, month: 2, day: 4).date!, score: 50, category: "B"),
        Record(date: DateComponents(calendar: .current, year: 2024, month: 2, day: 5).date!, score: 14, category: "A"),
        Record(date: DateComponents(calendar: .current, year: 2024, month: 2, day: 6).date!, score: 20, category: "B"),
        Record(date: DateComponents(calendar: .current, year: 2024, month: 2, day: 7).date!, score: 35, category: "A"),
        Record(date: DateComponents(calendar: .current, year: 2024, month: 2, day: 8).date!, score: 70, category: "B"),
        Record(date: DateComponents(calendar: .current, year: 2024, month: 2, day: 9).date!, score: 90, category: "A")

    ]

    var body: some View {
        Chart(records) { record in
            LineMark(
                x: .value("年月日", record.date),
                y: .value("点数", record.score)
            ).foregroundStyle(by: .value("category", record.category))
        }
    }
}
グラフの色を変える
グラフの色を変更したい場合はforegroundStyleに色を渡すだけです。
Chart(records) { record in
    LineMark(
        x: .value("年月日", record.date),
        y: .value("点数", record.score)
    ).foregroundStyle(.gray)
}複数のグラフを表示している場合はchartForegroundStyleScaleでそれぞれ色を指定することが可能です。
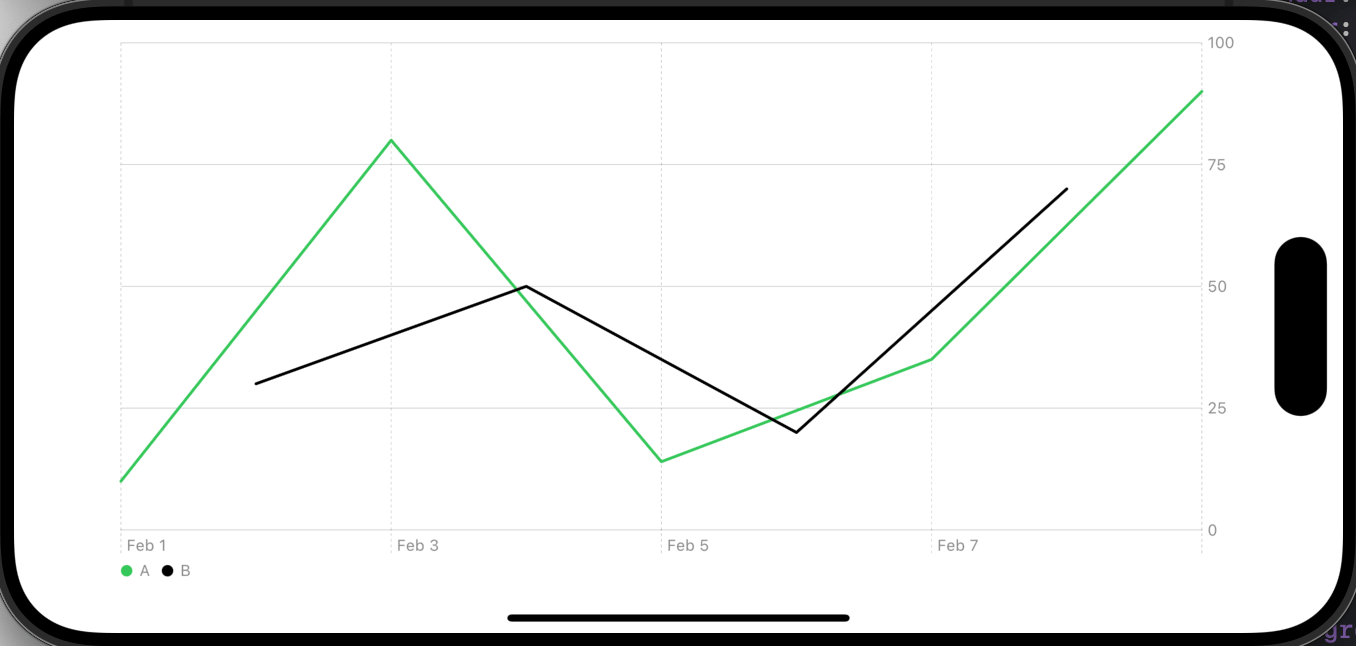
Chart(records) { record in
    LineMark(
        x: .value("年月日", record.date),
        y: .value("点数", record.score)
    ).foregroundStyle(by: .value("category", record.category))
}.chartForegroundStyleScale(["A": .green, "B": .black])
データポインタを設置する:symbol
折れ線グラフのデータ部分にポインタ(マーク)を設置したい場合はsymbolモディファイアを使用します。
 LineMark(
    x: .value("年月日", record.date),
    y: .value("点数", record.score)
).symbol(Circle()) 複数の折れ線グラフの場合はsymbol(by:)にて.value("カテゴリ名", 値)形式で渡すことでグラフごとにマークを自動で変えてくれるようです。
LineMark(
    x: .value("年月日", record.date),
    y: .value("点数", record.score)
).foregroundStyle(by: .value("category", record.category))
    .symbol(by: .value("category", record.category))
データポインタを設置する2:PointMark
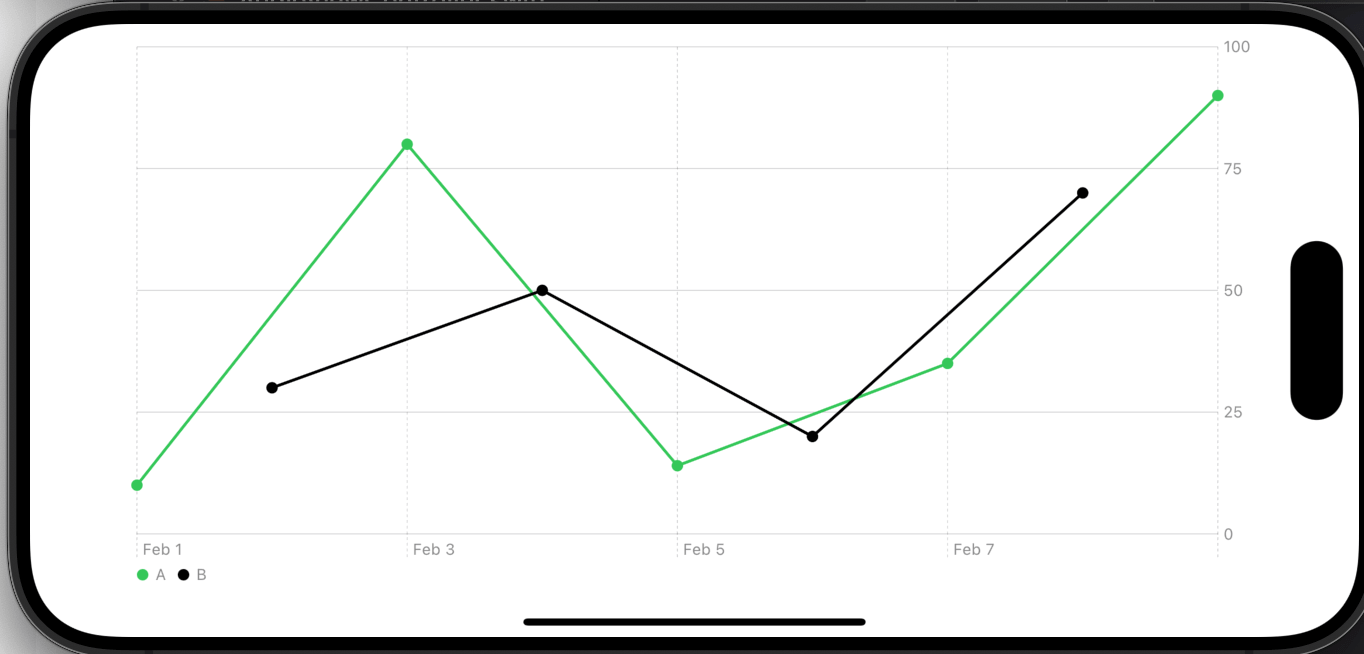
折れ線グラフのデータ部分にポインタ(マーク)を設置する別の方法としてChartの中にLineMarkとPointMarkを設置する方法もあります。
Chart(records) { record in
LineMark(
x: .value("年月日", record.date),
y: .value("点数", record.score)
).foregroundStyle(by: .value("category", record.category))
PointMark(
x: .value("年月日", record.date),
y: .value("点数", record.score)
).foregroundStyle(by: .value("category", record.category))
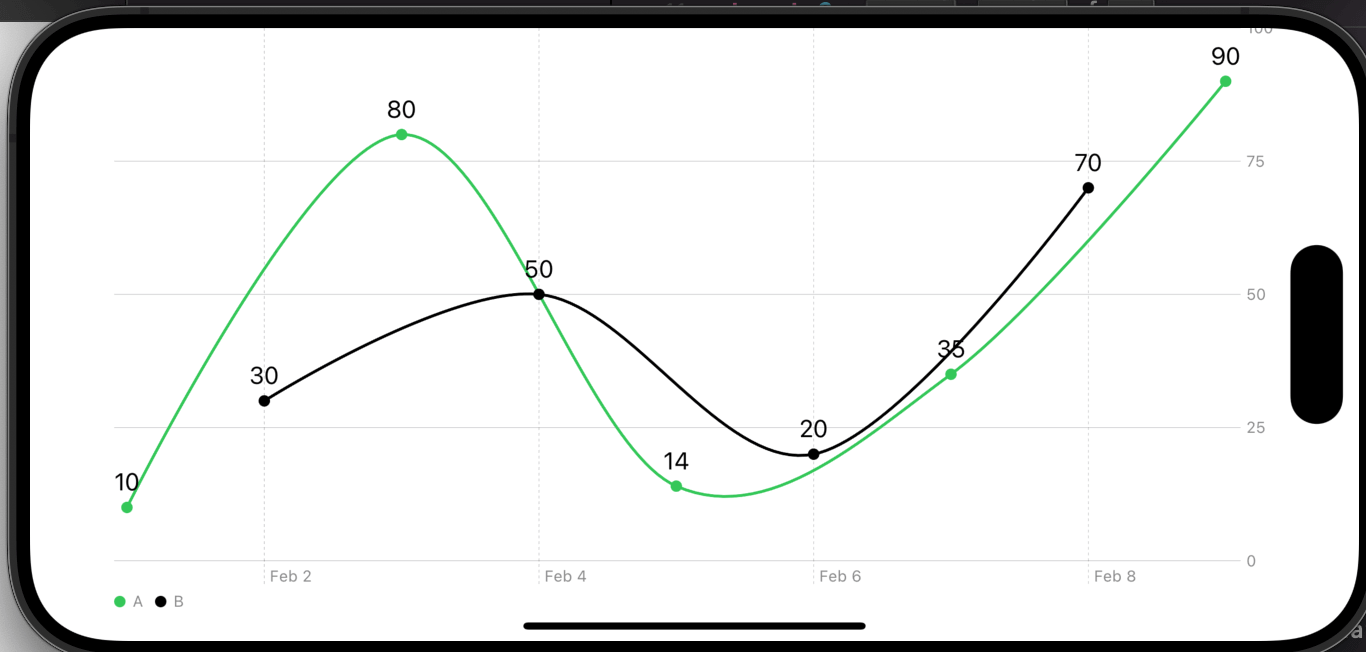
}.chartForegroundStyleScale(["A": .green, "B": .black])ポインタの上にデータを表示する
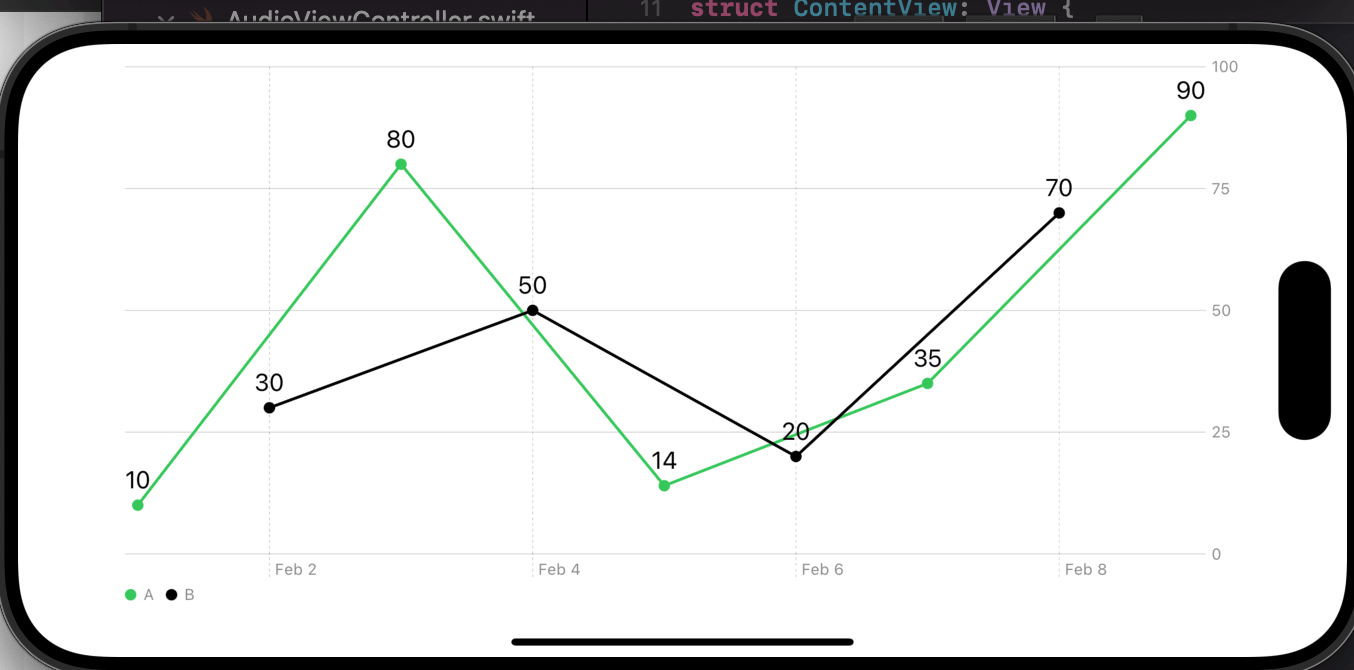
ポインタの上にデータなどを表示したい場合はannotationを使用します。しかしLineMarkに付与しても最初のデータしか表示されなかったのでPointMark側に付与することで表示させることができました。
Chart(records) { record in
    LineMark(
        x: .value("年月日", record.date),
        y: .value("点数", record.score)
    ).foregroundStyle(by: .value("category", record.category))

    PointMark(
        x: .value("年月日", record.date),
        y: .value("点数", record.score)
    ).foregroundStyle(by: .value("category", record.category))
        .annotation {
            Text("\(record.score)")
        }
}.chartForegroundStyleScale(["A": .green, "B": .black])
グラフの線の形状を変更する
折れ線グラフの線の形状を変更するにはinterpolationMethodを使用します。指定できる値はInterpolationMethodとして定義されている値です。
例えば曲線にしたい場合はcardinalを指定します。
LineMark(
    x: .value("年月日", record.date),
    y: .value("点数", record.score)
).foregroundStyle(by: .value("category", record.category))
    .interpolationMethod(.cardinal)
まだまだ勉強中ですので間違っている点や至らぬ点がありましたら教えていただけると助かります。
ご覧いただきありがとうございました。