【Xcode】LLDBとは?デバッグ機能の使い方とコマンドの種類!
この記事からわかること
- Xcodeで、デバッグ機能の使い方
- Xcodeのデバッガー:LLDBとは?
- ブレークポイントや変数の値を確認する方法
- ステップオーバーとステップイン、ステップアウトの違い
- LLDBのpやpoコマンドの種類
index
[open]
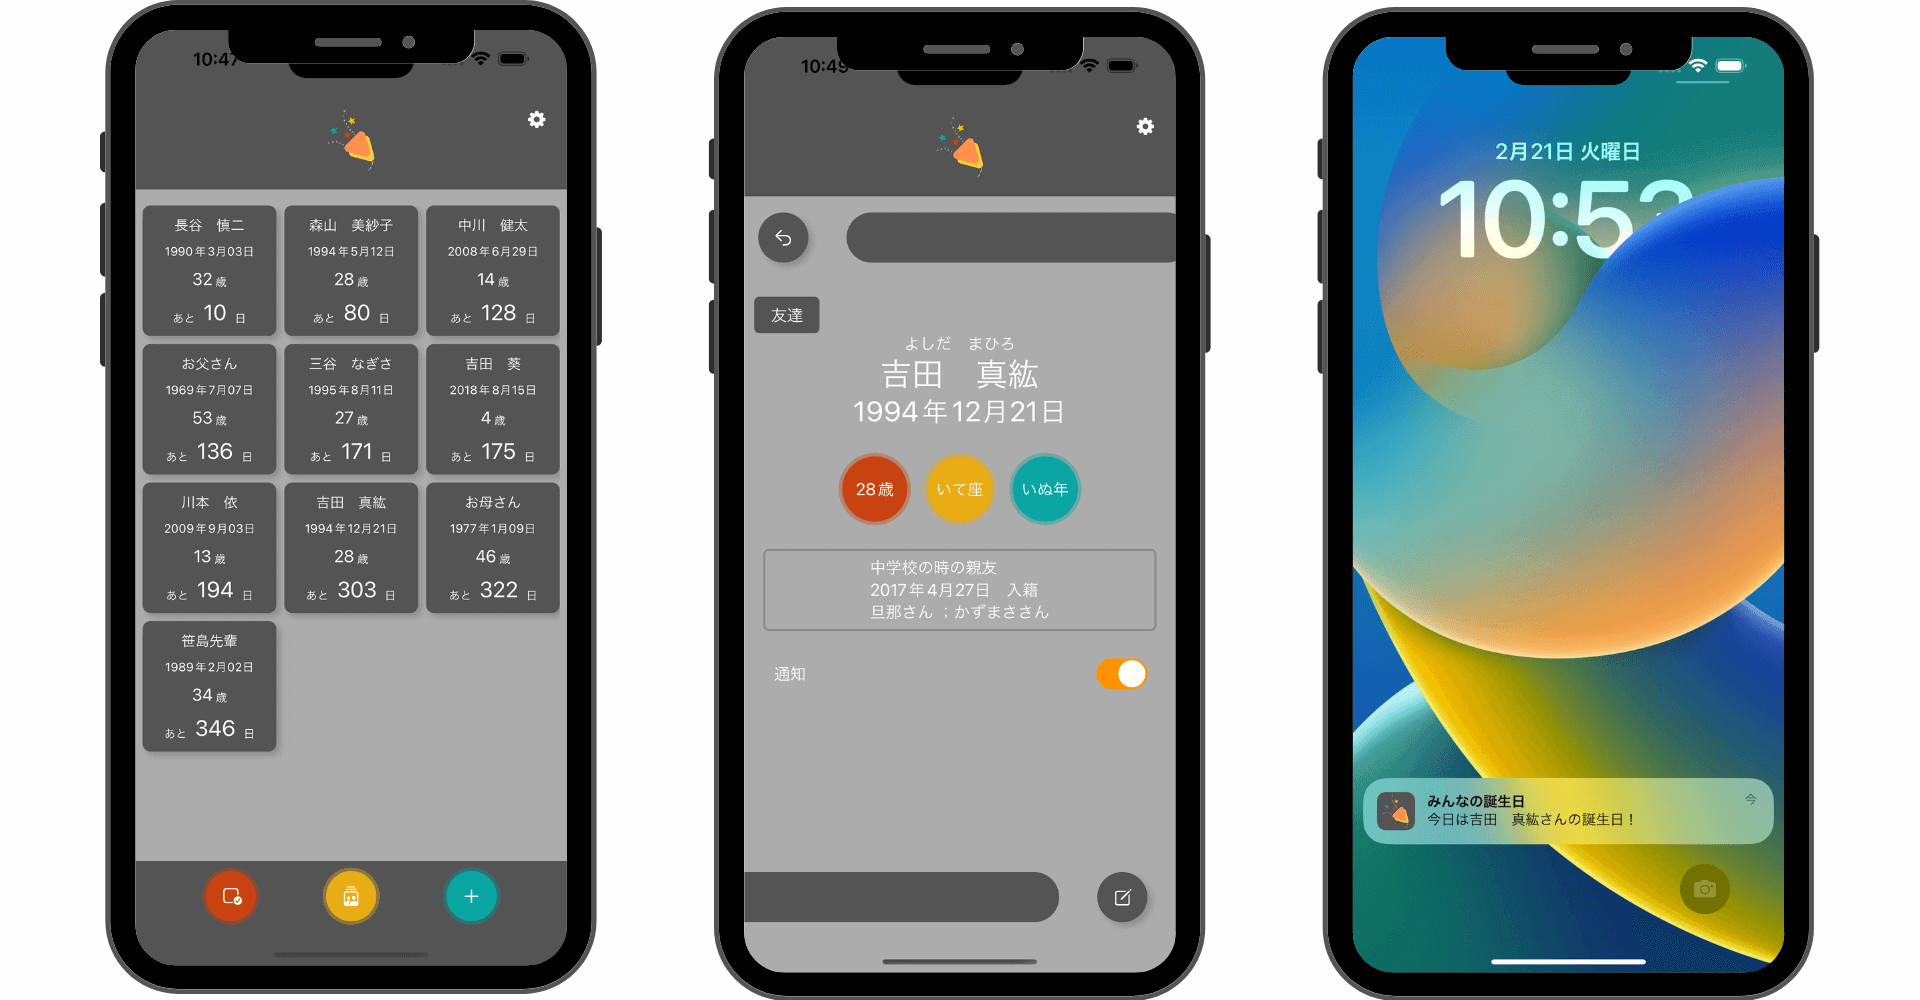
\ アプリをリリースしました /


Xcodeを使用したiOSアプリ開発におけるデバッグについてまとめていきます。
デバッグとは?
そもそもデバッグとはプログラムからバグ(不具合)を取り除くプロセスのことです。「de-」が「分離して」を「bug」が「虫(不具合を指す)」を表しており、繋げてdebug(デバッグ)と呼ばれます。
アプリなどを開発する際はユーザーの手に渡った後に予期せぬ挙動を起こさないよう、リリース前にプログラム内のエラーやバグを特定、修正しておくことが重要になります。
デバッグでやること
- エラーの特定
- エラーの再現
- エラーの修正
- テスト
これらを全て自力で行うのは時間と労力がかかりすぎるので効率的にデバッグを行うためのツールとしてデバッガーが用意されています。
デバッガーとは?
デバッガーとはデバッグを効率的に行うためのツールであり、プログラムの実行前に変数の値や実行パスの表示、特定の行にブレークポイントを配置して実行をコントロールするなどエラーを特定、修正するための機能が提供されています。
プログラミングの開発環境にはあらかじめデバッガーが組み込まれていることが多く、デバッガーの存在を意識せずともお世話になっていることが多いです。
iOSやmacOSアプリの統合開発環境(IDE)であるXcodeにもLLDBというデバッガーがあらかじめ含まれています。
LLDBとは?
LLDBとはXcodeにデフォルトで組み込まれているデバッガーでありC、C ++、Objective-C、Swiftなど様々な言語でのデバッグをサポートしています。昔はGNUデバッガー(GDB)というUNIX系OSで利用されているデバッガーが利用されていたようですが、Xcode4以降からLLDBに置き換わっているようです。
LLDB自体は LLVM(Low Level Virtual Machine)と呼ばれるコンパイラを生成するための基盤を構築するプロジェクトの一部として開発されたデバッガーです。
Xcodeのデバッグエリアにも以下のように(lldb)と表示されるので名称だけでも見たことがある人も多いかも知れません。
Xcodeを使用したデバッグ方法
LLDBは内部的に動作しており、XcodeからGUI操作でのデバッグが可能になっています。
XcodeからGUI操作でデバッグすることでいちいちアプリをビルドして変数の中身をprintで確認するといったことが必要がなく、ビルドしなくても動作や変数を確認しながら都度コードを書き換えていくことが可能になります。
まずはよく使う「ブレークポイント」から見ていきます。
ブレークポイント
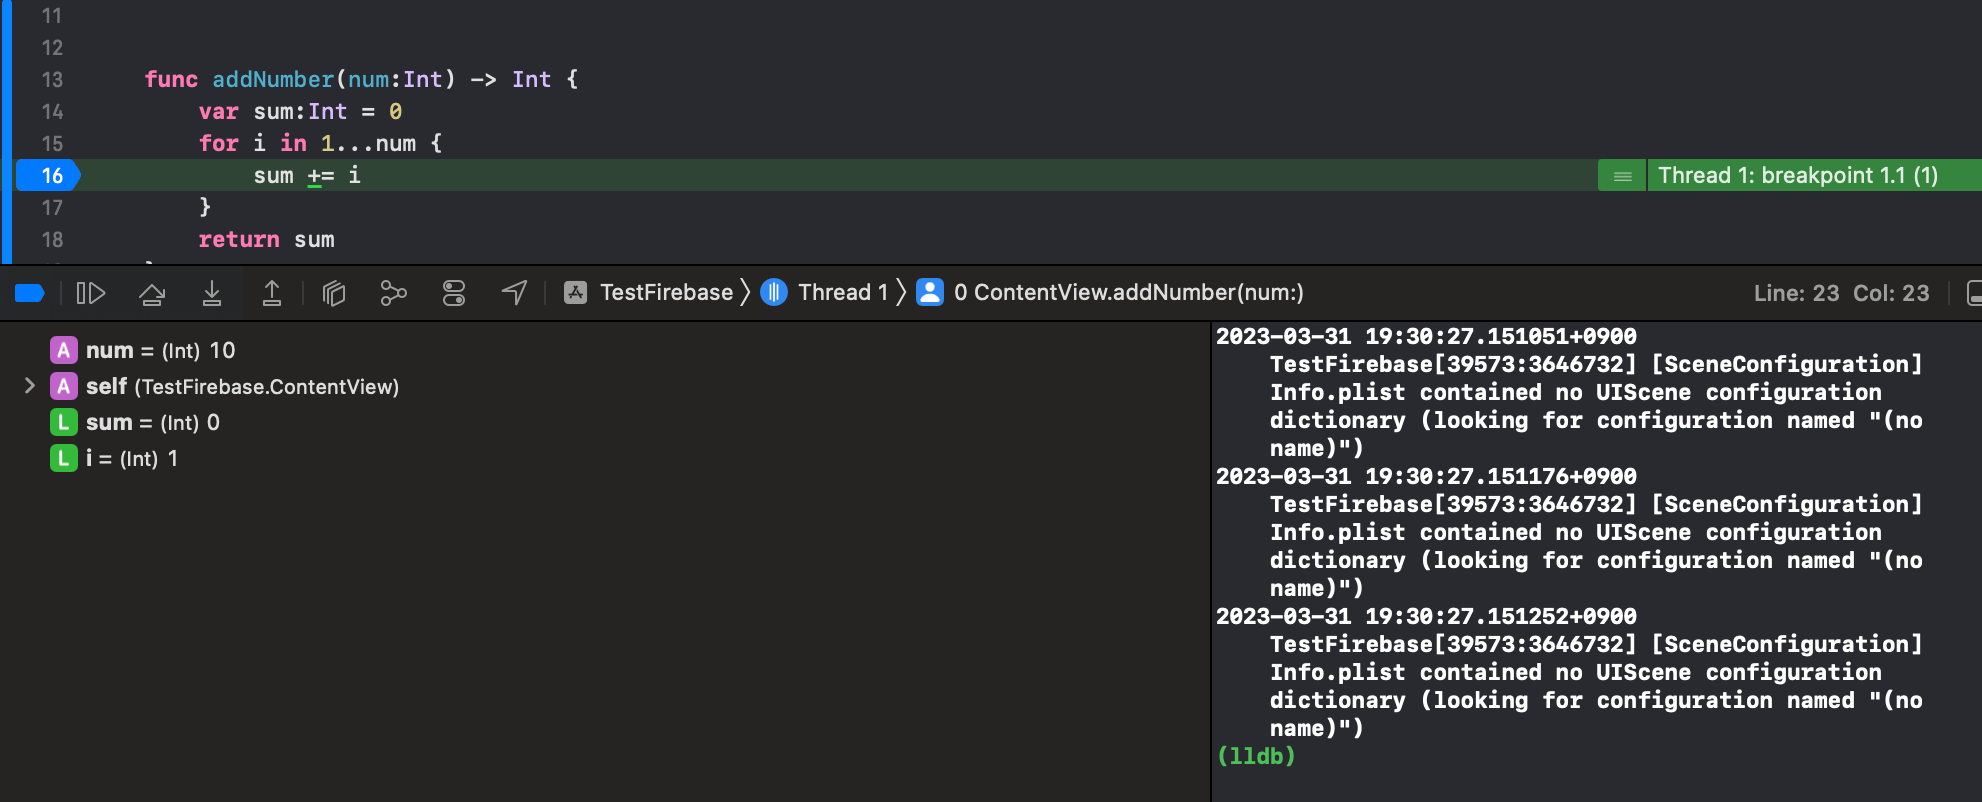
ブレークポイントとはプログラム実行時に特定の位置で処理を停止させるポイントのことです。実際にポイントを設置してみます。
Xcodeではエディタの左側の行No.をマウスでクリックすることでブレークポイントを設置できるようになっています。
ブレークポイントを設置したら一度実行してみるとブレークポイントに差し掛かったタイミングで処理が停止するのを確認できます。ブレークポイントを実行する前段階で停止しています。
変数の値を確認する
ブレークポイントを設置して処理を停止させた場合、付近にある変数の値を確認することが可能です。カーソルを確認したい変数に合わせることで中に格納されている値が表示されます。

1行ずつ実行する
ブレークポイントを設置して停止させるとデバッグエリアに以下のような複数のボタンが表示されます。左を1番として役割は以下の通りです。
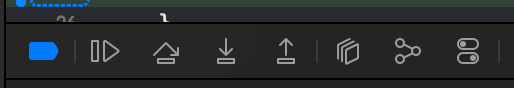
- ブレークポイントの有効/無効
- 実行再開
- 1行だけ実行(ステップオーバー)
- 1行だけ実行(ステップイン)
- 関数の外に出る(ステップアウト)
- Viewの重なりを確認
- ?
- モードや文字サイズなどアプリの環境設定
処理を1行だけ進めるには3番目か4番目のボタンをクリックします。するとプログラムが1行だけ実行され、複数回押すことで少しずつ動作を確認することができるようになります。
ステップオーバーとステップインの違い
ステップとはプログラムの処理単位のことです。そのステップ単位で実行させながら動作を確認するデバッグ方法としてステップ〇〇が用意されています。
ステップオーバー
1行ずつ処理を進める方式。関数がある場合は内部に入らず関数自体を実行する
ステップイン
1行ずつ処理を進める方式。関数がある場合は内部に入り、関数内を1行ずつ実行する
ステップアウト
関数内にいる場合に関数の外に出るまで処理を進める方式。
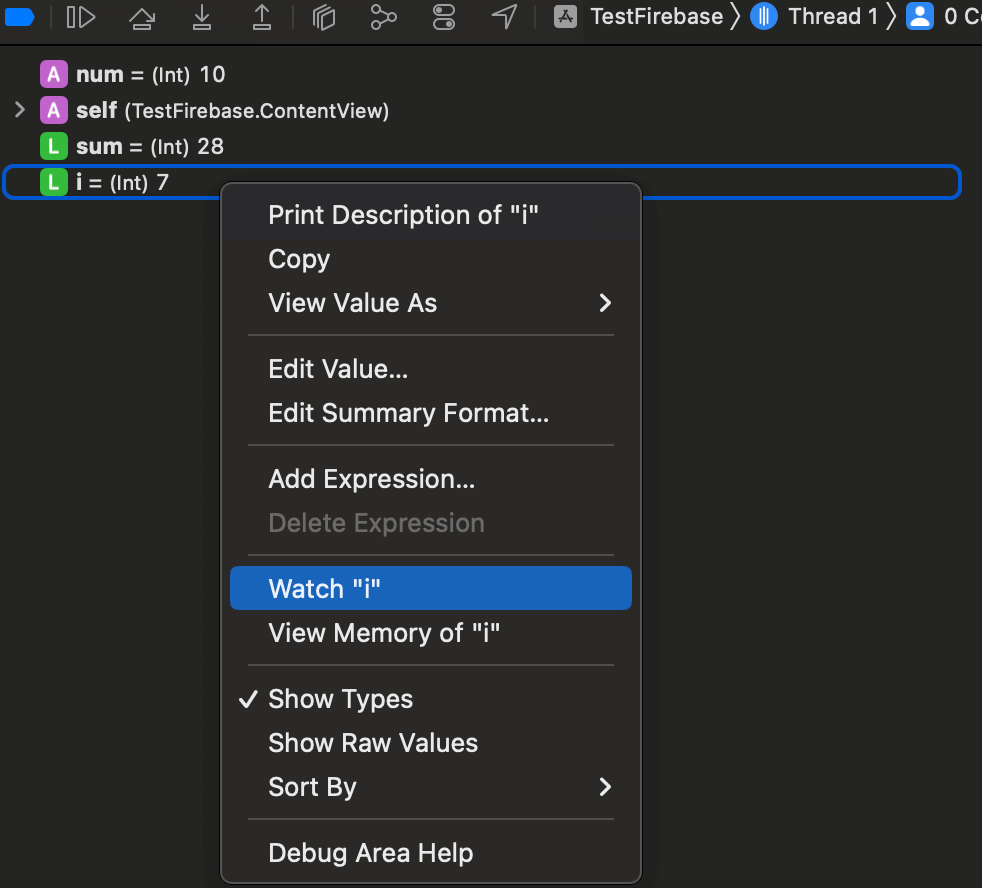
指定した変数の値の変更を検知する:ウォッチポイント
指定した変数の値が変更されたことを検知する「ウォッチポイント」を指定することもできます。
デバッグエリア内に表示されている変数を右クリックして「Watch "変数名"」をクリックします。これで監視状態になり変数の値が変更されたタイミングでWatchpoint 1 hit:と出力されるようになります。
LLDBのコマンドでデバッグ
ここまではデバッグ機能をGUI操作で利用してきましたが、XcodeからCUI操作でLLDBを利用することも可能になっています。
ブレークポイントを使って処理を停止させた際にデバッグエリアに(lldb)と表示されていたかと思います。実はこの横に任意のコマンドを入力することができるようになっています。
(lldb) p sum
// 結果:(Int) $R1 = 3またアプリがクラッシュした際にも(lldb)が表示されるのでそのままデバッグすることも可能になっています。
runコマンド
コマンド通りアプリを実行させます。
continueコマンド
停止位置から処理を再開します。cのみでもOK
stepコマンド
ステップイン。sのみでもOK
nextコマンド
ステップオーバー。nのみでもOK
finishコマンド
ステップアウト。
poコマンド
poはprint outの略称であり、変数の中身を見やすい形式で出力してくれるコマンドです。
pコマンド
似たような出力コマンドにpコマンドがあります。これはprintの略称です。
poコマンドとの違いは出力形式です。出力してみると中身が表示されるのは同じですが$R0と言った変数に格納されているのが確認できます。
この変数には後から参照できるのでクラスなどの場合は$R0.プロパティ名とすることで後から必要なデータだけを再参照することができます。
expressionコマンド
expression 変数 = 値で変数の値を書き換える
helpコマンド
使用できるコマンドはhelpコマンドで一覧表示できます。最後にhelpコマンドの全体を載せておきます。
(lldb) help
Debugger commands:
  apropos           -- List debugger commands related to a word or subject.
  breakpoint        -- Commands for operating on breakpoints (see 'help b' for
                       shorthand.)
  command           -- Commands for managing custom LLDB commands.
  disassemble       -- Disassemble specified instructions in the current
                       target.  Defaults to the current function for the
                       current thread and stack frame.
  expression        -- Evaluate an expression on the current thread.  Displays
                       any returned value with LLDB's default formatting.
  frame             -- Commands for selecting and examing the current thread's
                       stack frames.
  gdb-remote        -- Connect to a process via remote GDB server.
                       If no host is specifed, localhost is assumed.
                       gdb-remote is an abbreviation for 'process connect
                       --plugin gdb-remote connect://<hostname>:<port>'
  gui               -- Switch into the curses based GUI mode.
  help              -- Show a list of all debugger commands, or give details
                       about a specific command.
  kdp-remote        -- Connect to a process via remote KDP server.
                       If no UDP port is specified, port 41139 is
                       assumed.
                       kdp-remote is an abbreviation for 'process connect
                       --plugin kdp-remote udp://<hostname>:<port>'
  language          -- Commands specific to a source language.
  log               -- Commands controlling LLDB internal logging.
  memory            -- Commands for operating on memory in the current target
                       process.
  platform          -- Commands to manage and create platforms.
  plugin            -- Commands for managing LLDB plugins.
  process           -- Commands for interacting with processes on the current
                       platform.
  quit              -- Quit the LLDB debugger.
  register          -- Commands to access registers for the current thread and
                       stack frame.
  reproducer        -- Commands for manipulating reproducers. Reproducers make
                       it possible to capture full debug sessions with all its
                       dependencies. The resulting reproducer is used to replay
                       the debug session while debugging the debugger.
                       Because reproducers need the whole the debug session
                       from beginning to end, you need to launch the debugger
                       in capture or replay mode, commonly though the command
                       line driver.
                       Reproducers are unrelated record-replay debugging, as
                       you cannot interact with the debugger during replay.
  script            -- Invoke the script interpreter with provided code and
                       display any results.  Start the interactive interpreter
                       if no code is supplied.
  session           -- Commands controlling LLDB session.
  settings          -- Commands for managing LLDB settings.
  source            -- Commands for examining source code described by debug
                       information for the current target process.
  statistics        -- Print statistics about a debugging session
  swift-healthcheck -- Provides logging related to the Swift expression
                       evaluator, including Swift compiler diagnostics. This
                       makes it easier to identify project misconfigurations
                       that result in module import failures in the debugger.
                       The command is meant to be run after a expression
                       evaluator failure has occurred.
  target            -- Commands for operating on debugger targets.
  thread            -- Commands for operating on one or more threads in the
                       current process.
  trace             -- Commands for loading and using processor trace
                       information.
  type              -- Commands for operating on the type system.
  version           -- Show the LLDB debugger version.
  watchpoint        -- Commands for operating on watchpoints.
Current command abbreviations (type 'help command alias' for more info):
  add-dsym  -- Add a debug symbol file to one of the target's current modules
               by specifying a path to a debug symbols file or by using the
               options to specify a module.
  attach    -- Attach to process by ID or name.
  b         -- Set a breakpoint using one of several shorthand formats.
  bt        -- Show the current thread's call stack.  Any numeric argument
               displays at most that many frames.  The argument 'all' displays
               all threads.
  c         -- Continue execution of all threads in the current process.
  call      -- Evaluate an expression on the current thread.  Displays any
               returned value with LLDB's default formatting.
  continue  -- Continue execution of all threads in the current process.
  detach    -- Detach from the current target process.
  di        -- Disassemble specified instructions in the current target.
               Defaults to the current function for the current thread and
               stack frame.
  dis       -- Disassemble specified instructions in the current target.
               Defaults to the current function for the current thread and
               stack frame.
  display   -- Evaluate an expression at every stop (see 'help target
               stop-hook'.)
  down      -- Select a newer stack frame.  Defaults to moving one frame, a
               numeric argument can specify an arbitrary number.
  env       -- Shorthand for viewing and setting environment variables.
  exit      -- Quit the LLDB debugger.
  f         -- Select the current stack frame by index from within the current
               thread (see 'thread backtrace'.)
  file      -- Create a target using the argument as the main executable.
  finish    -- Finish executing the current stack frame and stop after
               returning.  Defaults to current thread unless specified.
  history   -- Dump the history of commands in this session.
               Commands in the history list can be run again using "!<INDEX>".
               "!-<OFFSET>" will re-run the command that is <OFFSET> commands
               from the end of the list (counting the current command).
  image     -- Commands for accessing information for one or more target
               modules.
  j         -- Set the program counter to a new address.
  jump      -- Set the program counter to a new address.
  kill      -- Terminate the current target process.
  l         -- List relevant source code using one of several shorthand formats.
  list      -- List relevant source code using one of several shorthand formats.
  n         -- Source level single step, stepping over calls.  Defaults to
               current thread unless specified.
  next      -- Source level single step, stepping over calls.  Defaults to
               current thread unless specified.
  nexti     -- Instruction level single step, stepping over calls.  Defaults to
               current thread unless specified.
  ni        -- Instruction level single step, stepping over calls.  Defaults to
               current thread unless specified.
  p         -- Evaluate an expression on the current thread.  Displays any
               returned value with LLDB's default formatting.
  parray    -- parray <COUNT> <EXPRESSION> -- lldb will evaluate EXPRESSION to
               get a typed-pointer-to-an-array in memory, and will display
               COUNT elements of that type from the array.
  po        -- Evaluate an expression on the current thread.  Displays any
               returned value with formatting controlled by the type's author.
  poarray   -- poarray <COUNT> <EXPRESSION> -- lldb will evaluate EXPRESSION to
               get the address of an array of COUNT objects in memory, and will
               call po on them.
  print     -- Evaluate an expression on the current thread.  Displays any
               returned value with LLDB's default formatting.
  q         -- Quit the LLDB debugger.
  r         -- Launch the executable in the debugger.
  rbreak    -- Sets a breakpoint or set of breakpoints in the executable.
  re        -- Commands to access registers for the current thread and stack
               frame.
  repl      -- Evaluate an expression on the current thread.  Displays any
               returned value with LLDB's default formatting.
  run       -- Launch the executable in the debugger.
  s         -- Source level single step, stepping into calls.  Defaults to
               current thread unless specified.
  shell     -- Run a shell command on the host.
  si        -- Instruction level single step, stepping into calls.  Defaults to
               current thread unless specified.
  sif       -- Step through the current block, stopping if you step directly
               into a function whose name matches the TargetFunctionName.
  step      -- Source level single step, stepping into calls.  Defaults to
               current thread unless specified.
  stepi     -- Instruction level single step, stepping into calls.  Defaults to
               current thread unless specified.
  t         -- Change the currently selected thread.
  tbreak    -- Set a one-shot breakpoint using one of several shorthand formats.
  undisplay -- Stop displaying expression at every stop (specified by stop-hook
               index.)
  up        -- Select an older stack frame.  Defaults to moving one frame, a
               numeric argument can specify an arbitrary number.
  v         -- Show variables for the current stack frame. Defaults to all
               arguments and local variables in scope. Names of argument,
               local, file static and file global variables can be specified.
               Children of aggregate variables can be specified such as
               'var->child.x'.  The -> and [] operators in 'frame variable' do
               not invoke operator overloads if they exist, but directly access
               the specified element.  If you want to trigger operator
               overloads use the expression command to print the variable
               instead.
               It is worth noting that except for overloaded operators, when
               printing local variables 'expr local_var' and 'frame var
               local_var' produce the same results.  However, 'frame variable'
               is more efficient, since it uses debug information and memory
               reads directly, rather than parsing and evaluating an
               expression, which may even involve JITing and running code in
               the target program.
  var       -- Show variables for the current stack frame. Defaults to all
               arguments and local variables in scope. Names of argument,
               local, file static and file global variables can be specified.
               Children of aggregate variables can be specified such as
               'var->child.x'.  The -> and [] operators in 'frame variable' do
               not invoke operator overloads if they exist, but directly access
               the specified element.  If you want to trigger operator
               overloads use the expression command to print the variable
               instead.
               It is worth noting that except for overloaded operators, when
               printing local variables 'expr local_var' and 'frame var
               local_var' produce the same results.  However, 'frame variable'
               is more efficient, since it uses debug information and memory
               reads directly, rather than parsing and evaluating an
               expression, which may even involve JITing and running code in
               the target program.
  vo        -- Show variables for the current stack frame. Defaults to all
               arguments and local variables in scope. Names of argument,
               local, file static and file global variables can be specified.
               Children of aggregate variables can be specified such as
               'var->child.x'.  The -> and [] operators in 'frame variable' do
               not invoke operator overloads if they exist, but directly access
               the specified element.  If you want to trigger operator
               overloads use the expression command to print the variable
               instead.
               It is worth noting that except for overloaded operators, when
               printing local variables 'expr local_var' and 'frame var
               local_var' produce the same results.  However, 'frame variable'
               is more efficient, since it uses debug information and memory
               reads directly, rather than parsing and evaluating an
               expression, which may even involve JITing and running code in
               the target program.
  x         -- Read from the memory of the current target process.
For more information on any command, type 'help <command-name>'.
まだまだ勉強中ですので間違っている点や至らぬ点がありましたら教えていただけると助かります。
ご覧いただきありがとうございました。